Software Solutions for Emission Modelling
When you want to solve real-world planning problems or answer questions from people that are affected by noise pollution, it is not enough to create accurate predictions of noise exposure. It is necessary to translate the numbers into a format that speaks for itself - be it in form of maps that clarify exposure statistics or in form of succint reports that reduce the information to the essential. LimA offers a range of analysis options that help to answer the planning questions and guide engineers and policy-makers alike to take the right decisions.
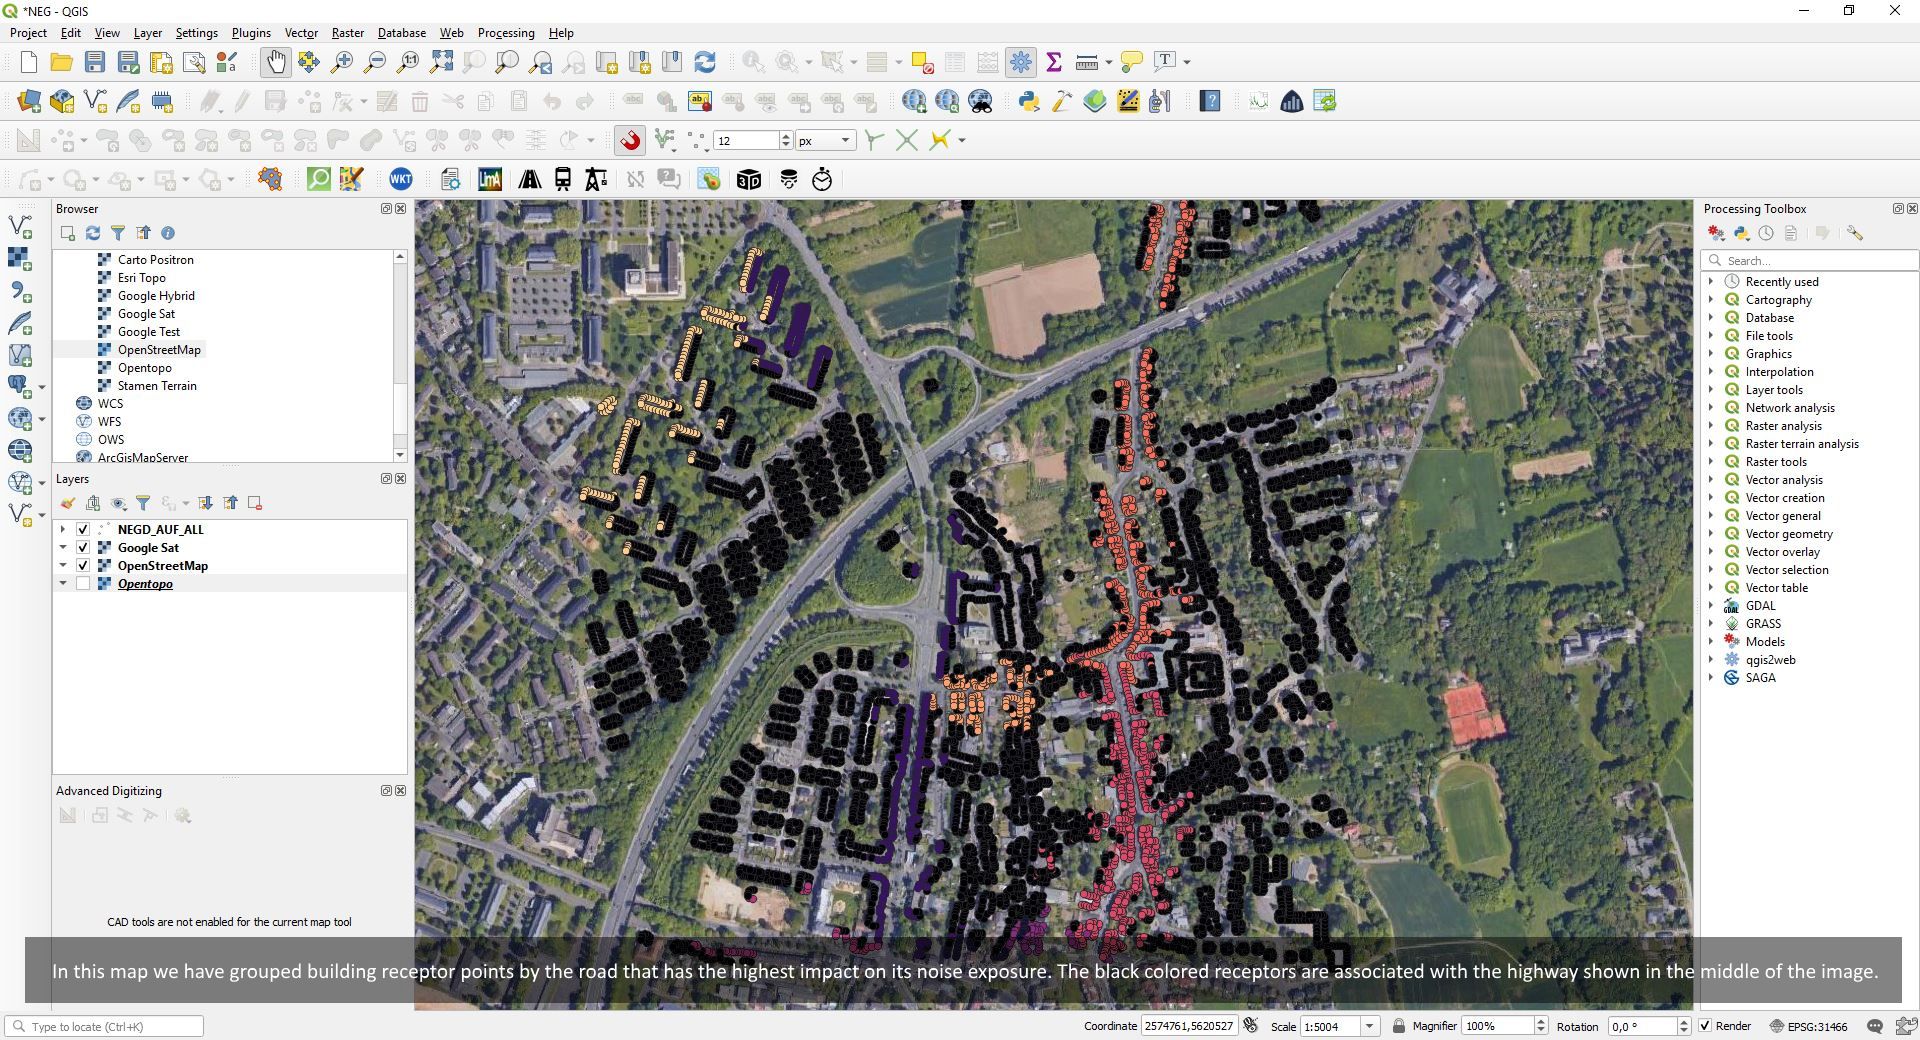
A frequent question that is being asked by policy makers and urban planners is: Which roads have the highest disturbance potential for residents and where should we focus our efforts to minimize traffic noise? Stapelfeldt has developped the Noise Emitter Group (NEG) analysis that answers this exact question. Buildings are grouped by the road that has the biggest impact on its overall exposure. As shown in the screenshot, this analysis enables decision makers to quickly identify the most problematic roads and assign resources to them. This analysis can also be applied to areas.
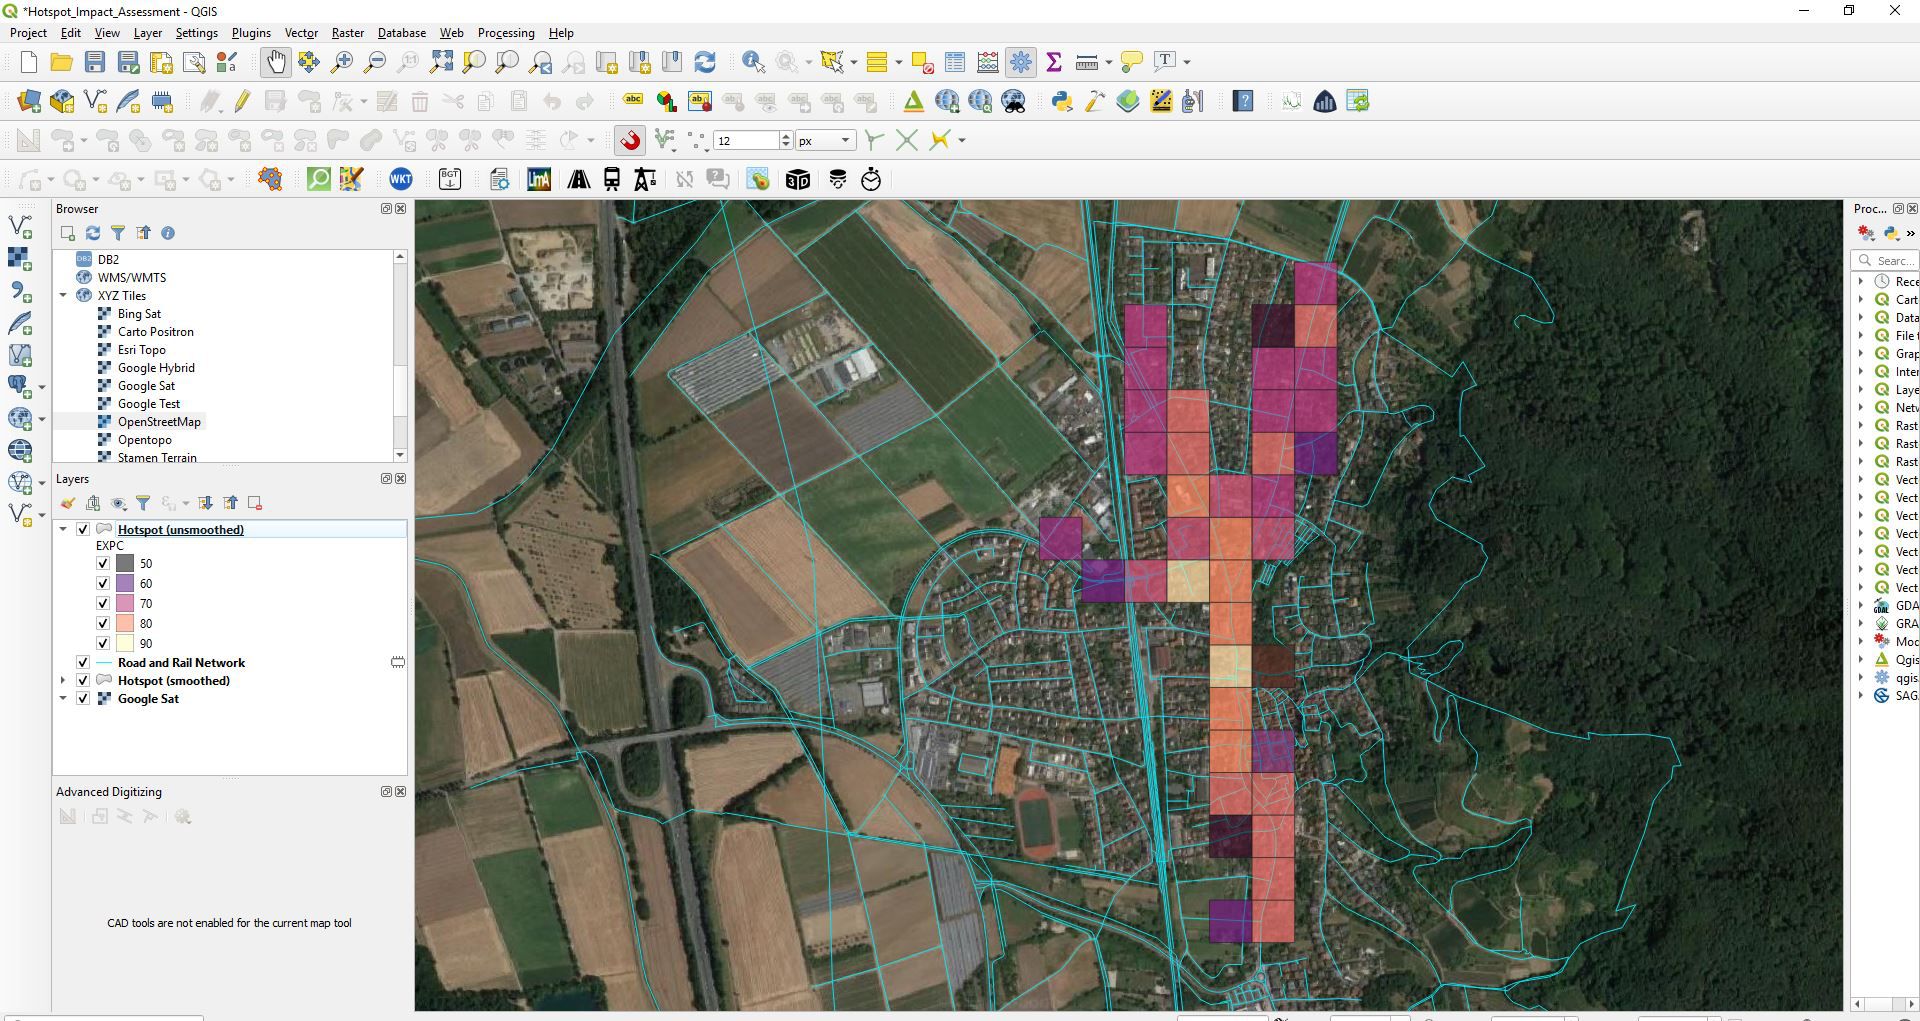
Another analysis that helps to guide ressources to the areas most affected by traffic noise, is the Hotspot Analysis. This method was developed on demand of a European country that wanted to know which areas are most affected by noise exposure. The analysis draws a grid across the area of interest and calculates a logarithmic sumproduct of the inhabitant count and the respective noise exposure level for each grid cell.
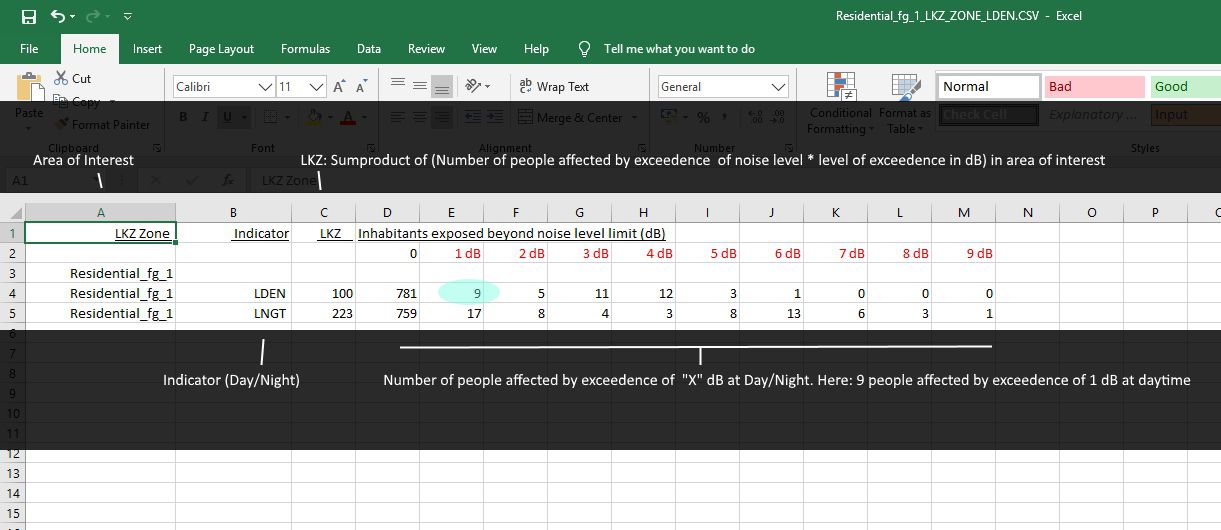
While maps of noise levels help to understand and communicate the sources and propagation paths of noise, they do not show us exactly how many people are affected by what noise levels. This is where the top-of-the-line post-processing and analysis features of LimA make the big difference. Wether you want to know how many people are exposed to noise levels exceeding the limits by 4 dB in a given area or how high the expected maximum noise level of individual facades are: LimA provides output tables and mapping options that leave no questions unanswered.
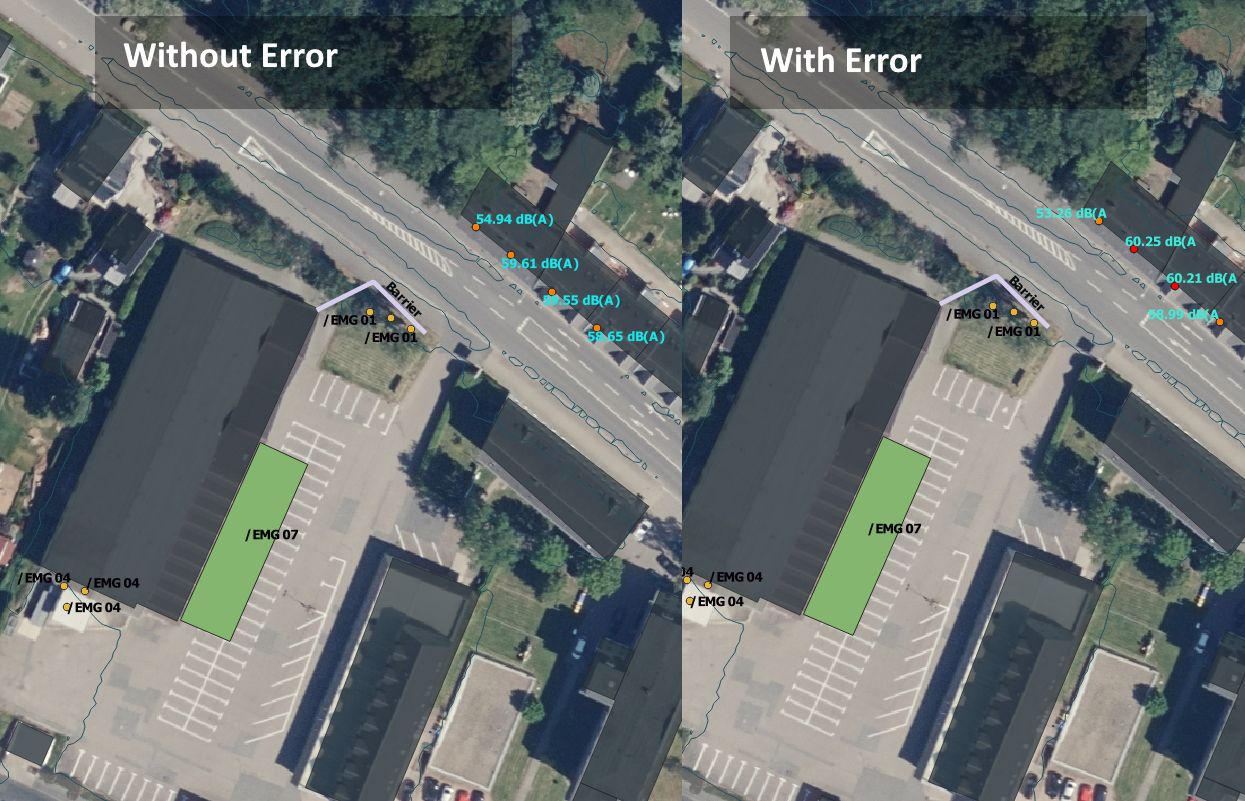
Noise models are an approximation of reality and real noise levels. Depending on the model, different aspects like geometry or variation of source levels can have different effects on receiver levels and propagation. LimA let's you assess these effects by considering standard deviations of source levels and errors in geometry that may arise during the digitization process and as a result of geodata inaccuracy.